The Metrics, Explained
Since 2002, bluecrossbar.com has calculated a “performance” score for every team after each and every league match – that’s over 56,000! The scores we calculate for each match are based on many hundreds of factors, but take into account:
- The opposing team, and their strength
- The Referee
- Goals scored and conceded
- Shots for/against
- Shots on target (for/against)
- Shots missed
- Red and yellow cards
- Amongst many other factors
HOW ARE THESE PERFORMANCES SHOWN?
The first thing you'll notice about the football predictor is that it won't give you a definitive one-word answer as to which team may win any given match. Instead, it will give you six strong indicators on which to make your judgement.
THE GOLDEN RULE
The following rule applies to all of the metrics:
- If the number is negative – this means the away team should win. A larger number suggests a stronger chance of the away team winning.
- If the number is positive – this means the home team should win. A larger number suggests a stronger chance of the home team winning.
WHAT WE SHOW YOU
For every match prediction you make, we’ll show you six figures:
HEAD TO HEAD
This figure tells you how both teams have performed the last 5 times they met.
A positive score shows that the home team the has performed better in previous encounters.
A negative score shows that the away team has performed better in previous encounters.
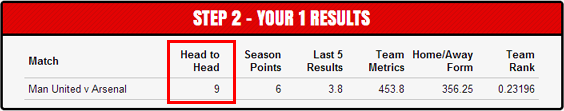
In this example, Man Utd have won the most previous encounters.
SEASON POINTS
This shows you, at a glance, the points difference between both teams this season.
A positive number shows the home team is higher in the league.
A negative number shows the away team is higher in the league.
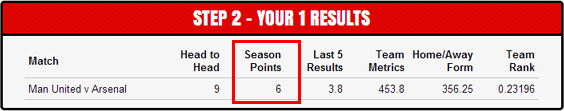
In this example, Man Utd have 6 more points this season.
LAST 5 RESULTS
This score calculates the points earned by both teams over the last 5 matches – and weights them based on how recent each match was, and calculates a weighted score.
A positive number suggests the home team has performed better in recent matches.
A negative number suggests the away team has performed better in recent matches.
In this example, Man Utd have won more points in the last 5 matches.

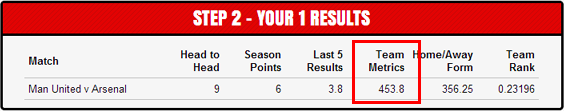
TEAM METRICS
This score looks at the last 5 performances from both teams, and calculates a single score which demonstrates how each team has performed.
A positive number suggests the home team has performed better in recent matches.
A negative number suggests the away team has performed better in recent matches.
Again, in this example, Man Utd have performed better in the last 5 matches.
HOME/AWAY FORM
This score works exactly as above, but factors in each team’s home, or away form. For example, if you are predicting Chelsea [home] vs. Man Utd [away]:
The metric will analyse Chelsea’s last 5 home performances and Man Utd’s last 5 away performances.
A positive number suggests the home team will perform better at home in this match.
A negative number suggests the away team will perform better away in this match.

In this example, Man Utd have performed better in their last 5 home matches, compared with Arsenal’s last 5 away matches.
TEAM RANK
This figure tells you, at a glance, which team has been the most successful over the last 10 years.
A positive number shows the home team has been more successful, while a negative number shows the away side is the more successful of the two.
This metric allows you to understand, at a glance whether either team are, historically, punching above their weight.

In this example, Man Utd are historically, the most successful team.
POINTS TO REMEMBER
- Larger numbers suggest a greater certainty.
- You may find that when you predict a match, the numbers may appear evenly matched. In this case, a draw is the most likely result.
OUR TOP TIP
bluecrossbar.com suggests that if you wish to predict the outcome of 5 football matches, select 10 matches in the football predictor and choose the five most likely outcomes.